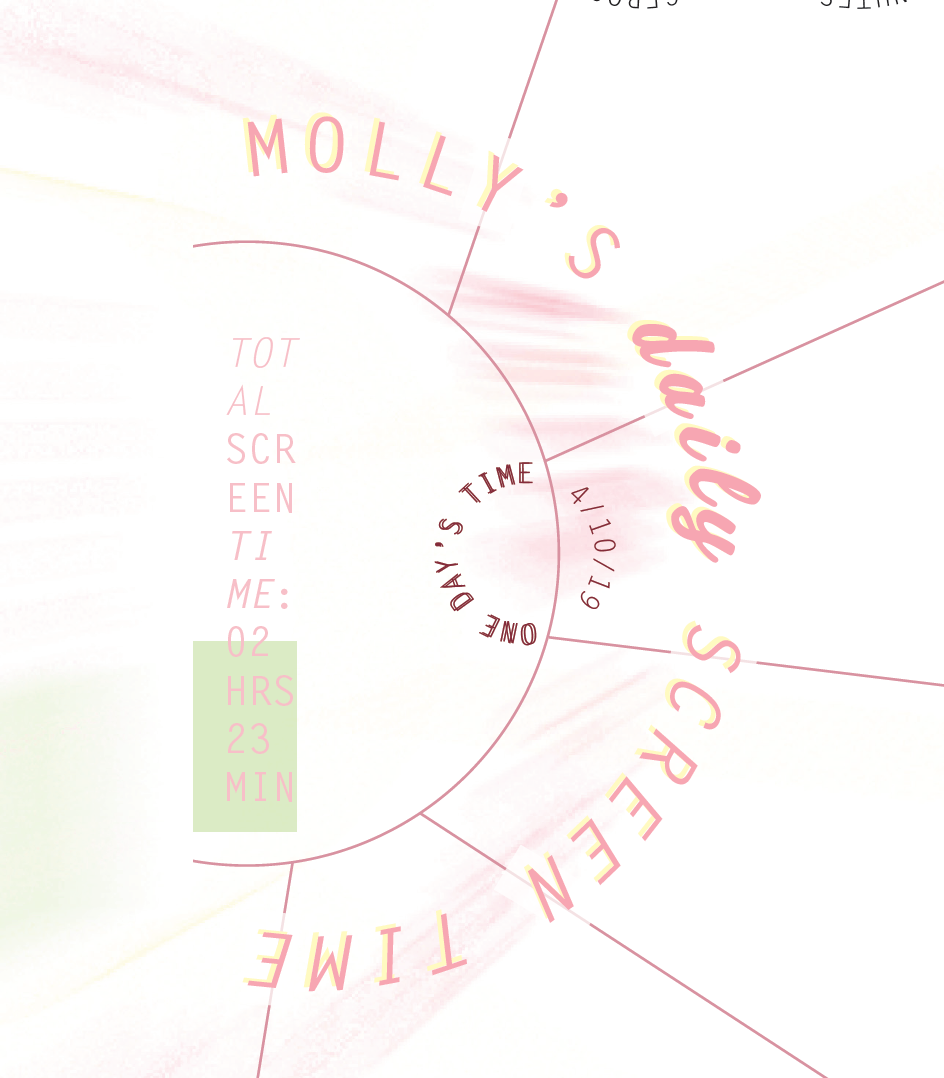
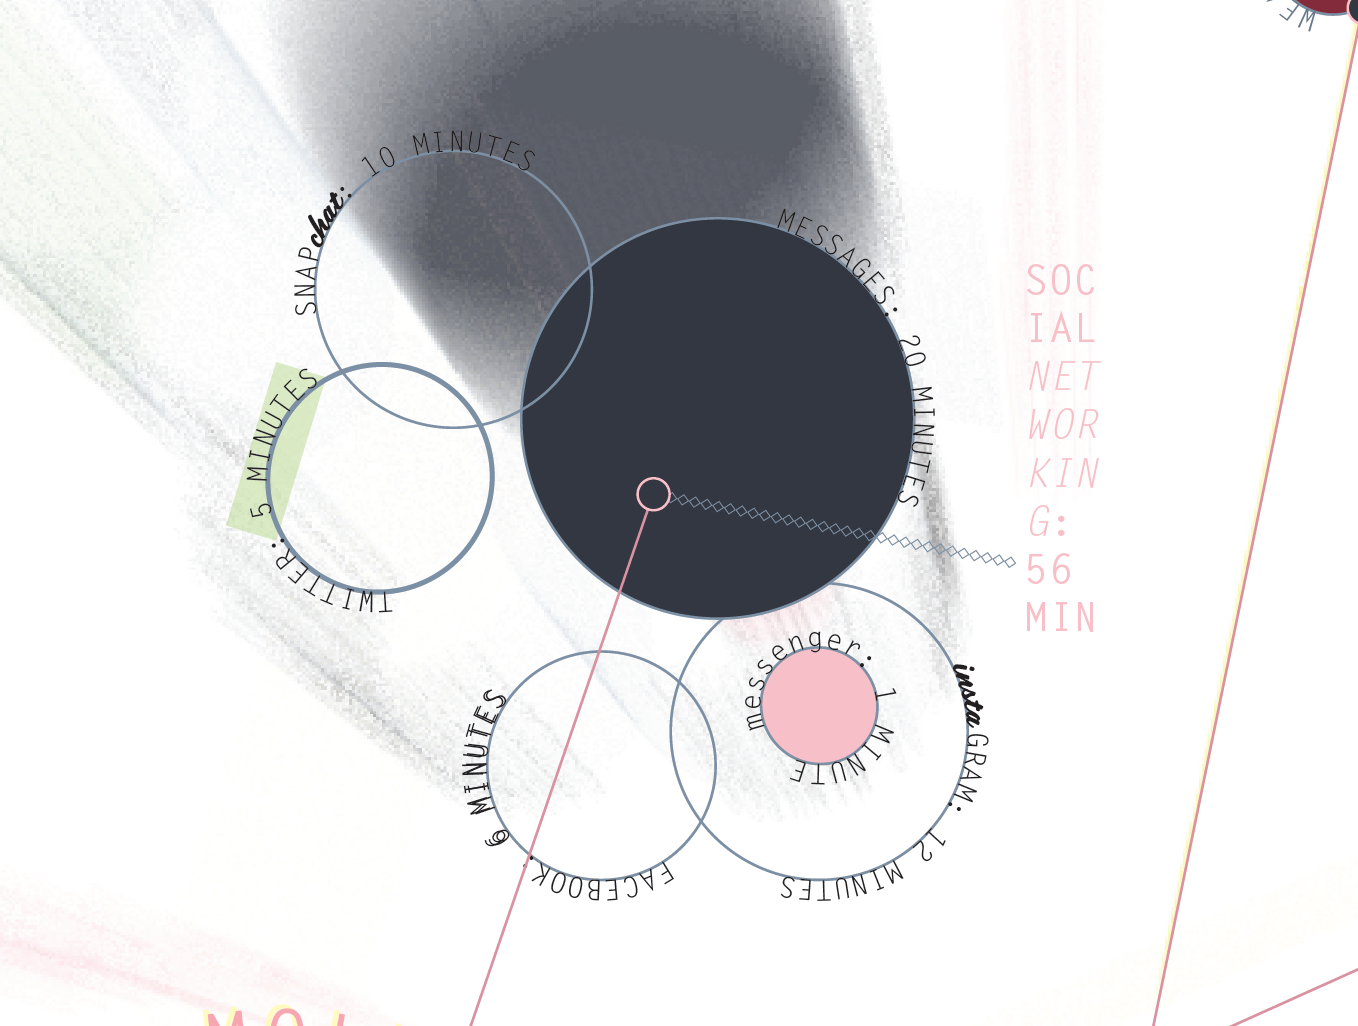
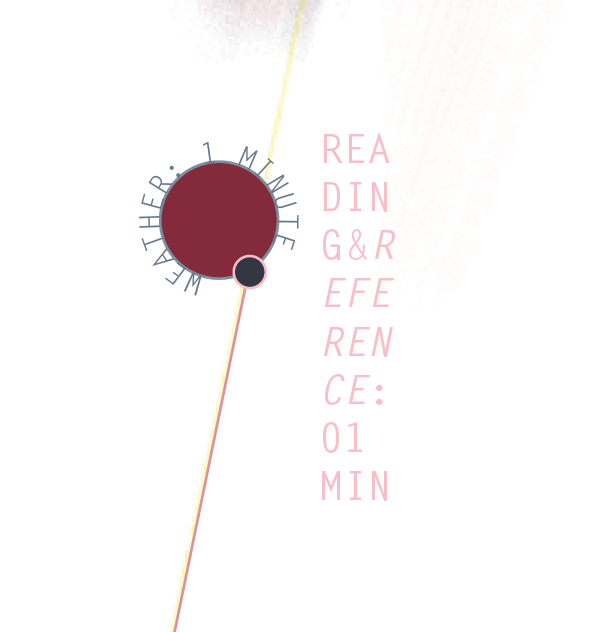
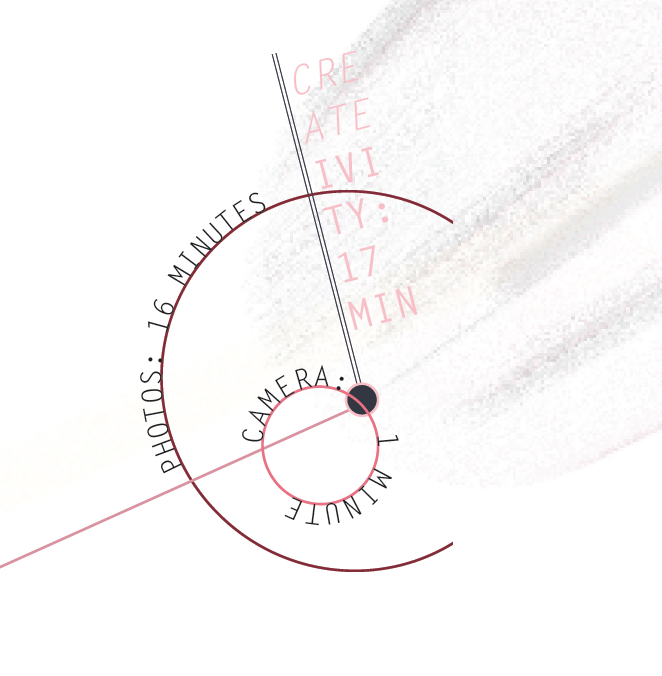
Designer notes: Infographic developed to communicate data collected at the end of a normal day of cellphone usage. Apple's iPhones now track your screen time as you use your phone. It categorizes the different groups of apps (social networking, entertainment, etc.) and displays the minutes used through each app. This infographic is my take of creative expression meeting content communication.


To push this project further, I would love to incorporate more UX design. The user would be able to click on each individual bubble on their screen to read about the categories/more specification of what they are looking at when they read "X" time on "X" app,
